
How Do You Use a Journey Map?
[This is the third in a series of three articles on customer journey maps: what is a customer journey map, how to read them, and how to use them to improve your customers’ experiences.]
How Do You Use a Journey Map?
A customer journey map helps organize your research findings in a way that uncovers patterns, reframes the data, and helps your team identify new insights. Along the way, you’ll validate (or reject) assumptions and get insights into your customers and stakeholders that you just can’t get from a straight-up process map.
For example, a journey map will show you how your different channels (Touchpoints) are involved in the customer experience, as well as which ones are missing. The Direct Farm Loans Customer Journey Map dramatically shows the critical, hands-on role of loan officers as a resource for producers… a theme that emerged time and time again in our field interviews.
How Do Journey Maps Help Organizations?
Journey maps give your organization’s leaders a literal big picture that can help you:
- Set Organizational Priorities and Allocate Resources: Journey maps dramatically illustrate complexities, deficiencies, and opportunities in your systems. Areas with lots of red pain points, (like the most complex phases for both producers and loan officers, the Apply and Processing phases)…
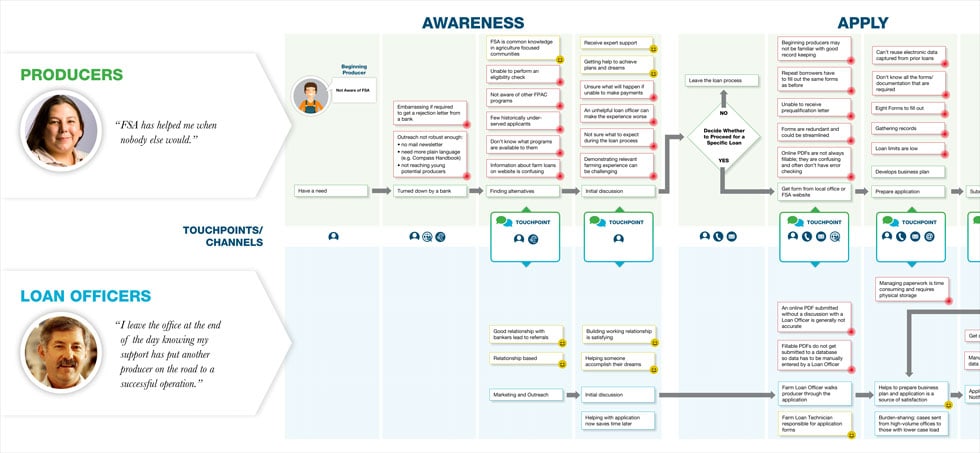
…are good areas to look at for developing potential solutions. And because journey maps show your customers’ emotional journey in the context of your business processes and systems, they’re especially useful for helping decisionmakers figure out which efforts will have the biggest impact on improving customer experiences.
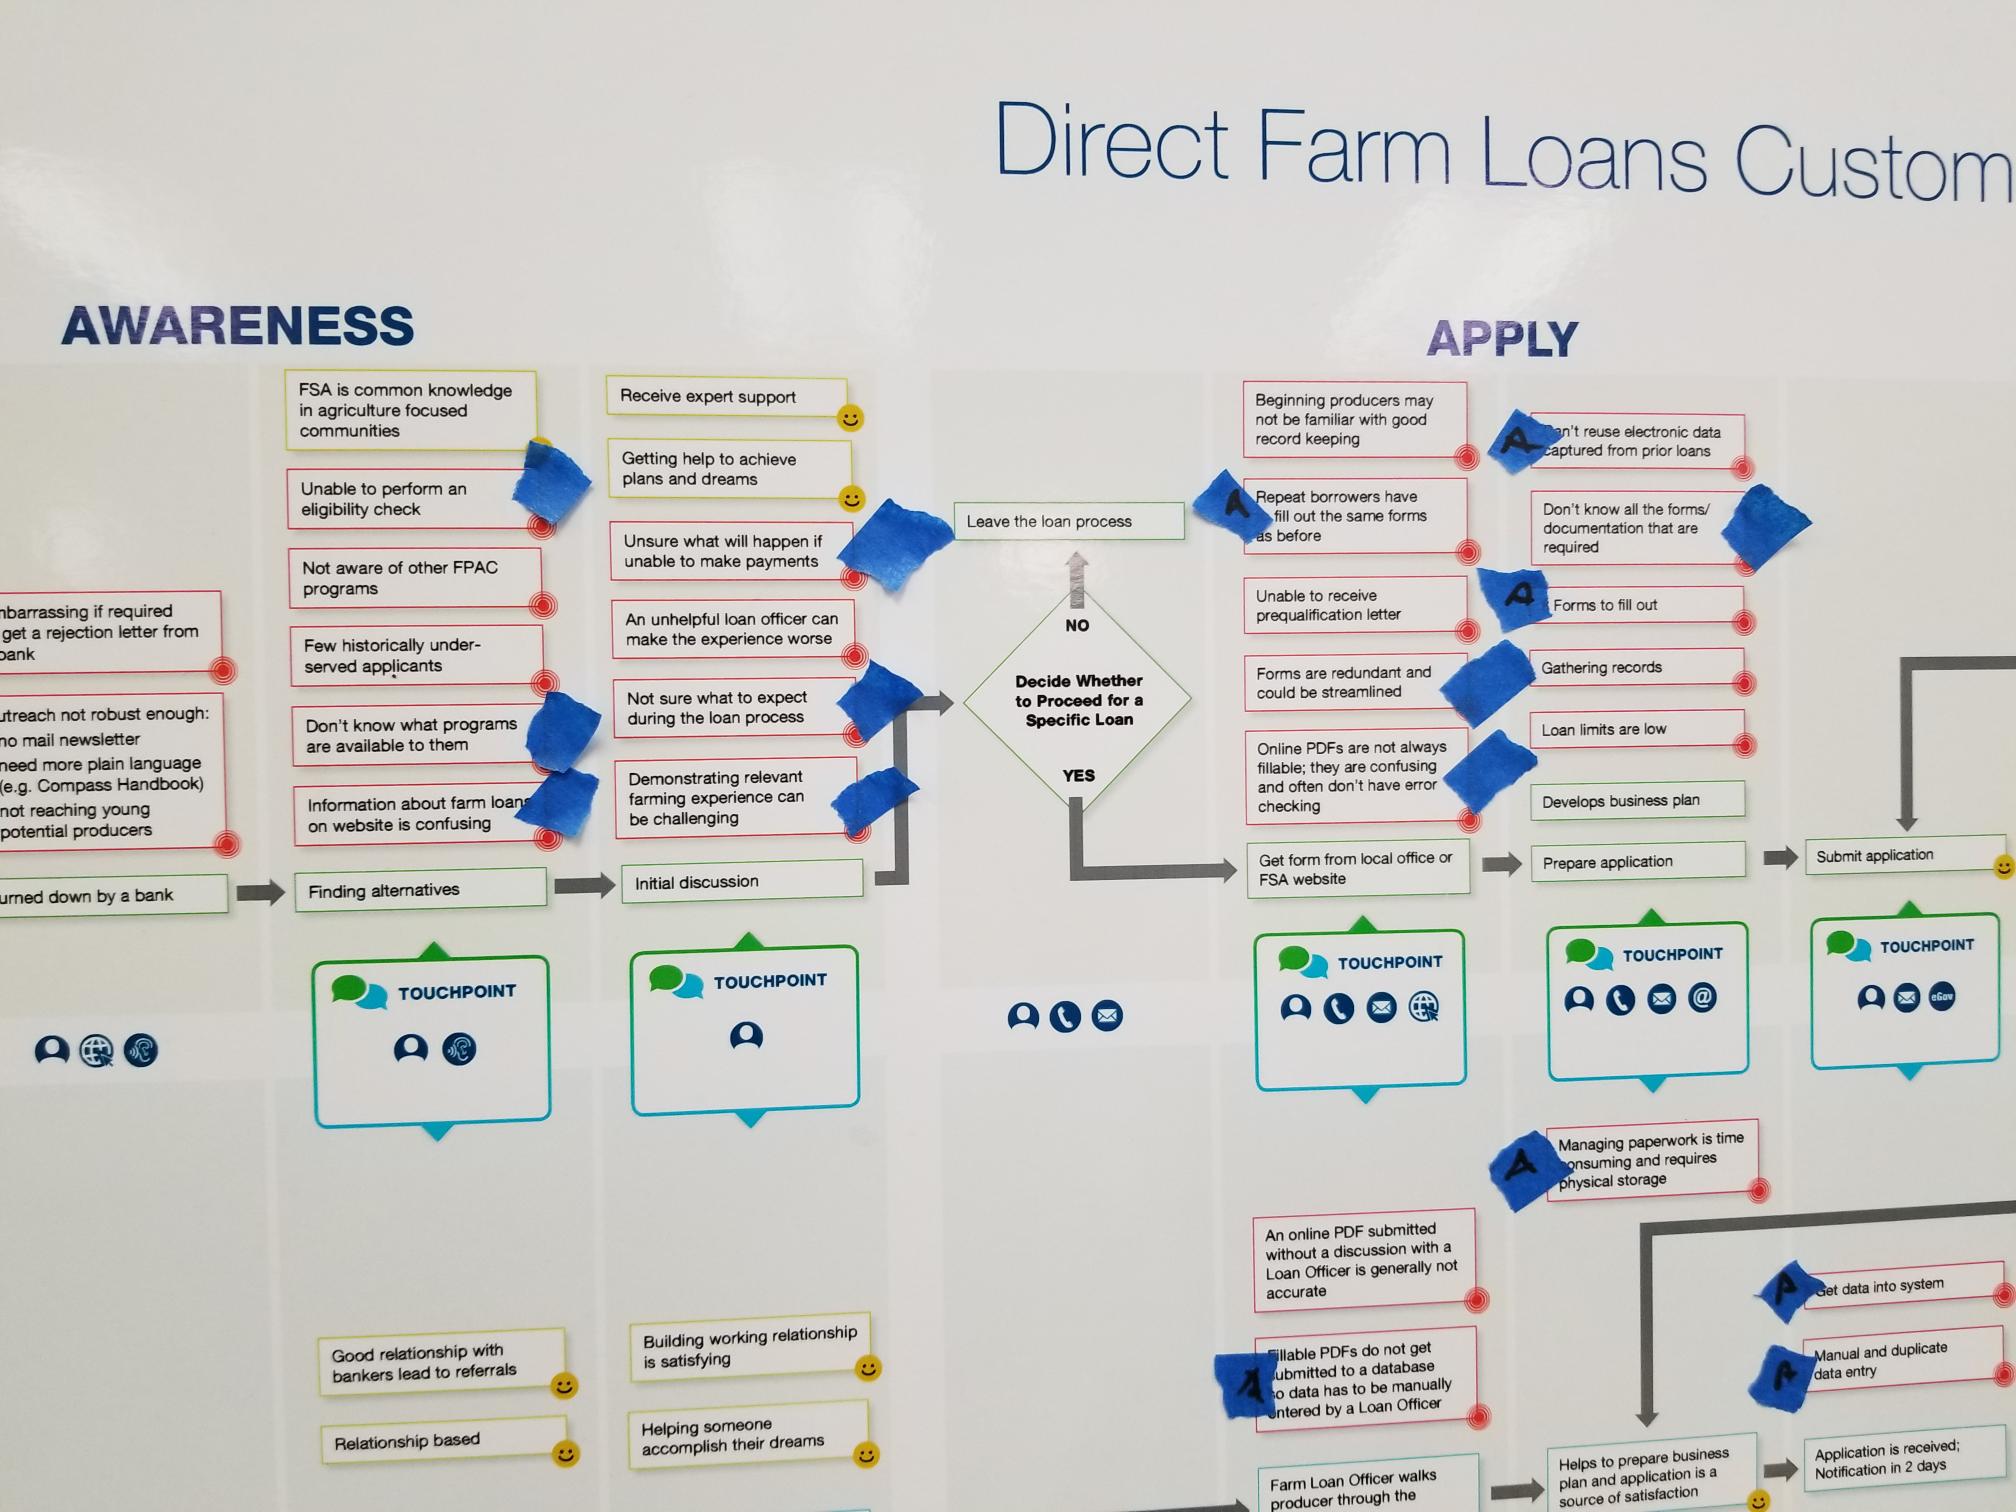
- Identify Process Improvements: By zooming in, you can identify specific pain points (or clusters of pain points) that you want to target using lean process management or whatever other process improvement method your organization uses. For example, this annotated view of the Farm Loans journey map shows pain points that we’re specifically developing solutions for in our current work (as well as work being done by other USDA agencies that affect the Farm Loans experience):
- Coordinate Efforts: Again, by zooming out, you can give your stakeholders a common picture of where everyone fits into the process. By doing so, you get a clearer understanding of how you can fix an entire segment of the customer’s journey.
For Farm Loans, the team made several recommendations for addressing producer pain points in these phases, including the use of relatively simple, quick-to-implement method. This Phase 1 final report accompanies the journey map and lays out findings and recommendations.
Creating a journey map is a vital part of the process of creating customer experiences that are truly customer-centric. But the map is just a model and serves as a starting point—stay tuned for more details on how the CX CoE is working to turn these customer insights into solutions.
Return to Updates