
The OneUSDA Ecosystem: Visualizing the Connections Between USDA Customers, Services, and Agencies
By The USDA Customer Experience Center of Excellence Team
Background
The United States Department of Agriculture (USDA) is made up of 29 agencies and offices, with nearly 100,000 employees at over 4,500 locations, and offers services to every single person in the US and hundreds of millions more internationally. This gigantic span of customers and services makes it hard for USDA employees and customers to understand—let alone navigate—the web of connections between agencies, programs, and services, hindering collaboration and access to services.
The Customer Experience Center of Excellence (CX CoE) set out to visually represent the OneUSDA Ecosystem: a comprehensive view of USDA services and customers, with the power to reveal overlaps, bring clarity to complex customer and employee interactions, and uncover opportunity areas within the department and its agencies.
The Process
We started by looking at USDA agencies’ own words. We completed a Communications Audit that manually scraped all of USDA’s publicly available web domains creating a complete list of the services offered, as well as top customer archetypes (generalized composite views of their typical customers).
Through the audit, we identified 748 services reaching 903 unique customer archetypes. For example, a unique customer is “Grain producers looking at mycotoxin testing for their wet/dry storage.”To make this more manageable and to target our field research, we grouped similar customers to 213 non-unique customer types, and formed 24 broad customer archetypes.
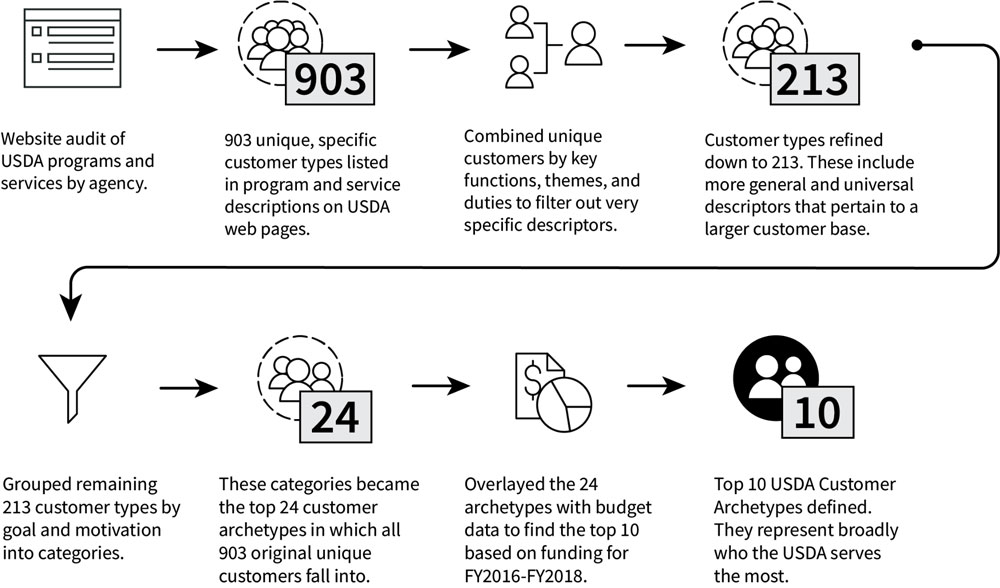
Caption: Showing the process from 903 unique customers to 10 archetypes.
We then incorporated other data sources, including the prior customer experience research from USDA’s Office of Customer Experience; USDA’s spending priorities from USAspending.gov and USDA strategic planning documents; and customer input and sentiment data from the “Tell Sonny” database provided by the Voice of the Customer (VoC) CoE, to prioritize top 10 USDA customer archetypes:
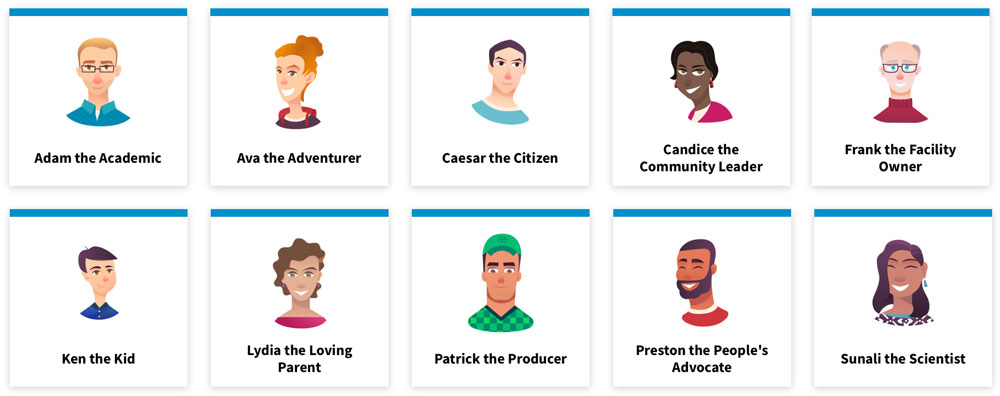
Caption: USDA’s Top 10 customer archetypes.
We also identified the areas of service associated with each customer archetype, where USDA agencies play a role in delivering services. (Note that in a real life scenario, customers might be associated with multiple areas of service—a food producer lives at home, works on a farm, has kids in school, etc.—but for our visualization, each customer matched one-to-one with a location):
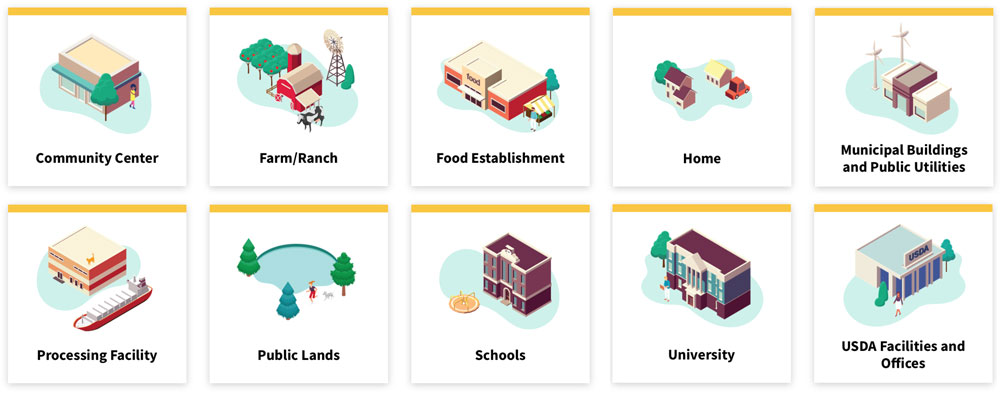
Caption: Areas of service associated with each of USDA’s top 10 customer archetypes.
With a broad, data-driven view of USDA’s customers and areas of service, we then moved on to make sure we captured the perspective of USDA’s human customers. We selected a single starter archetype—people who receive benefits through USDA’s Supplemental Nutrition Assistance Program (SNAP)—and developed a customer persona for someone interacting with USDA in her effort to provide her family safe and nutritious meals: Lydia.
Field Research
Supported by this data and persona, we dug into our primary research, conducting discovery interviews where we asked USDA employees and customers open-ended, probing, and data-driven questions about the programs and services USDA offers; how USDA agencies collaborate with other agencies; and this framing question: “How does your agency help Lydia as she tries to provide her family safe and nutritious meals?”
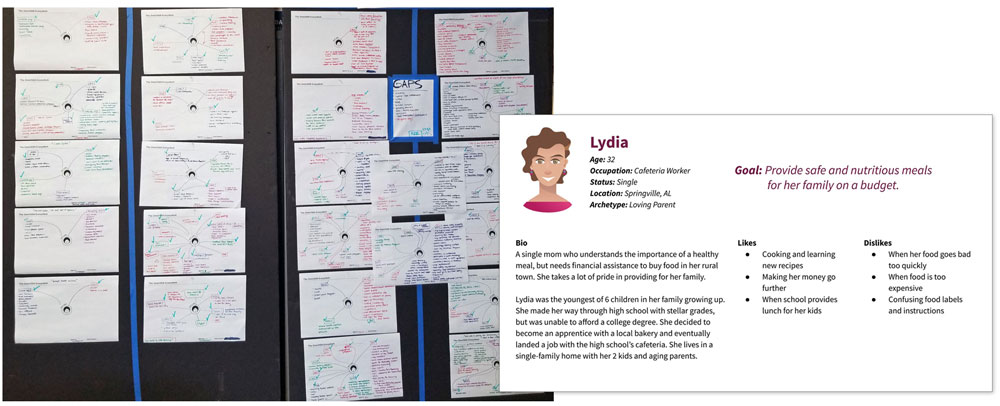
Caption: After initial interviews with USDA staff and customers, we captured their insights about the Lydia archetype (left) and used them to inform a more-detailed Lydia persona (right).
We also conducted 20 intercept interviews at a Maryland Farmers Market, asking customers about their experiences receiving USDA services, their approaches to healthy eating, and their awareness of SNAP EBT acceptance at the market.
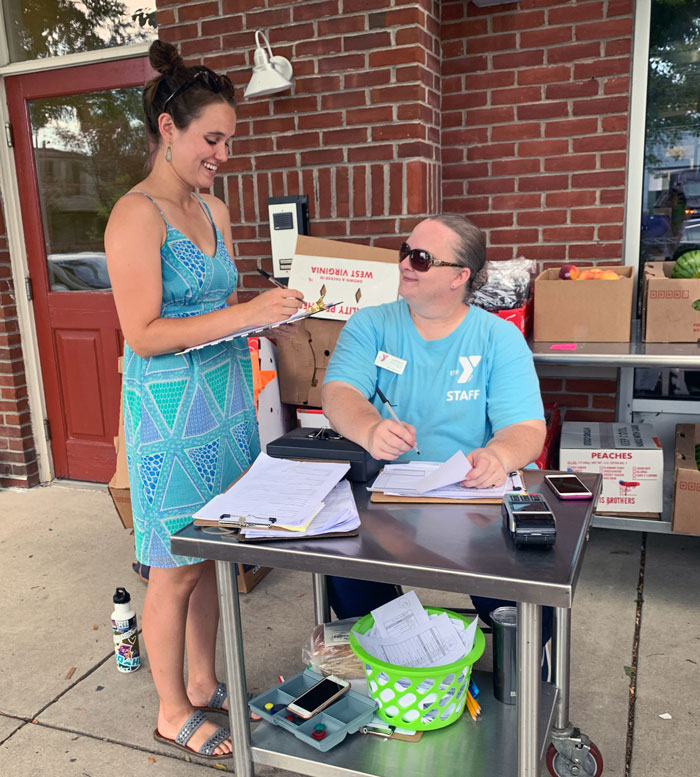
Caption: Conducting intercept interviews with farmers market staff in Maryland.
Putting It All Together
As we proceeded through our research, we started building our OneUSDA Ecosystem map, which had the goal of representing all these interrelationships between customers, services, and agencies. Each of the 10 customer archetypes has a corresponding Service Location (like Oscar the Owner and his Processing Facility), and listed with both are the USDA agencies that provide services to them.
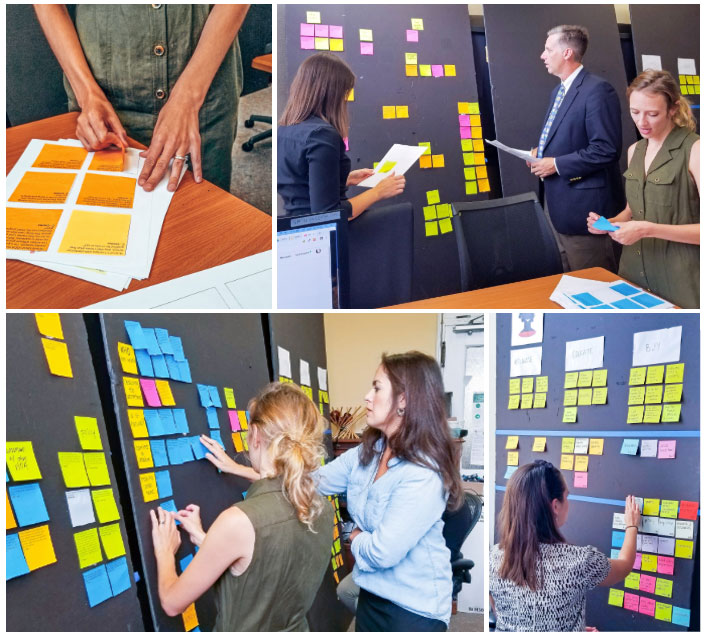
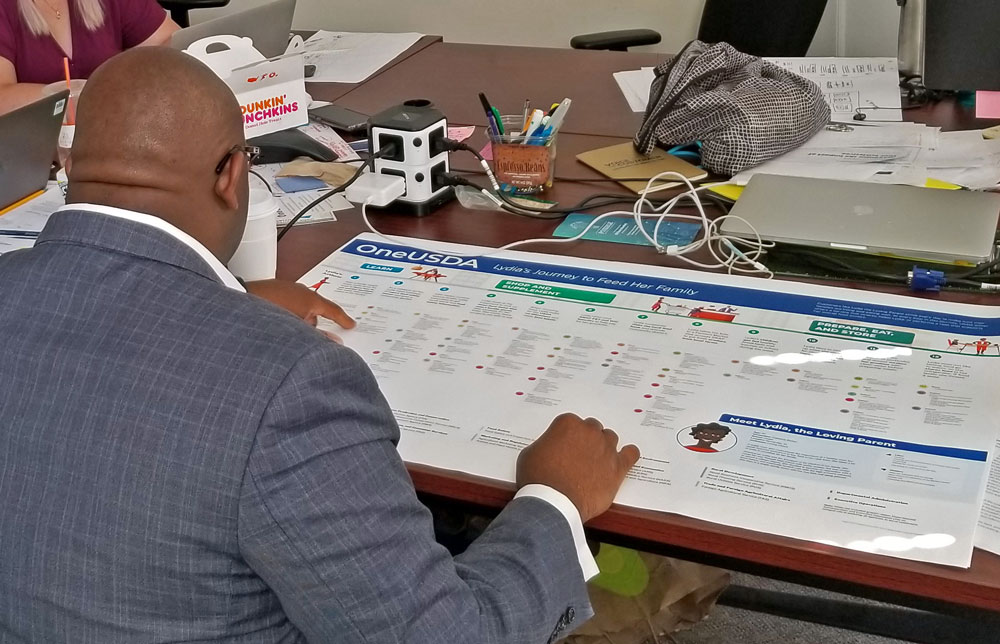
Caption: CX CoE researchers and GSA staff synthesize data points and quotes from interviews and observations.
Because of the amount of data we needed to show, in addition to the OneUSDA Ecosystem Map, we decided to also create a Lydia Service Blueprint.
This provides a comprehensive, big picture “ecosystem” view of USDA’s agencies, services, and customers, including where agencies overlap in delivering services to customers. Any person looking at the map should be able to see where and how USDA agencies meet the needs of specific customers. The map is a resource for USDA staff to rethink how their agencies can work together to champion customer experiences in ways that span multiple agencies and locations.
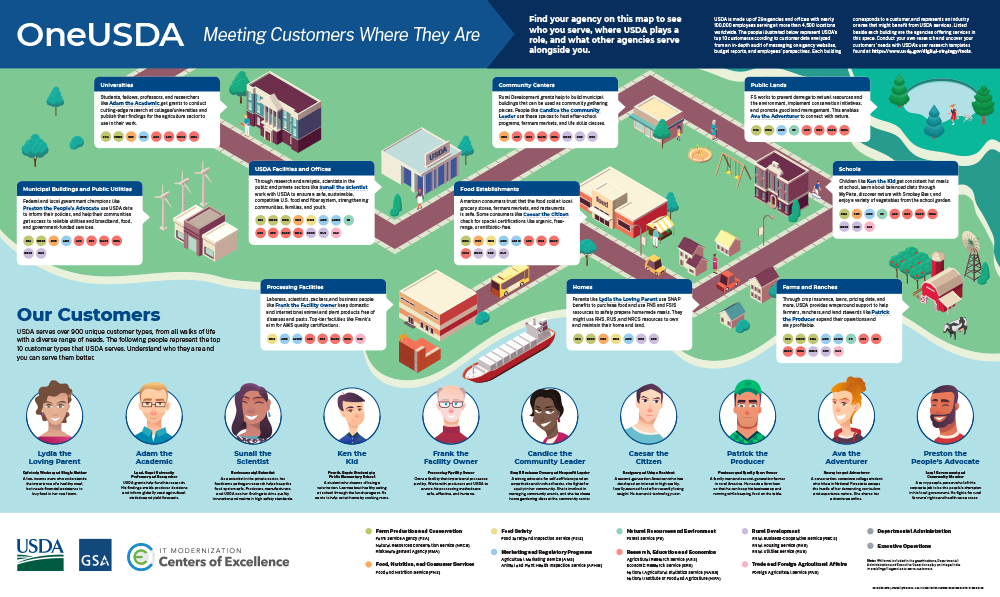
Caption: The OneUSDA Ecosystem map presents a simplified, department-wide view of USDA’s agencies, services, and customers.
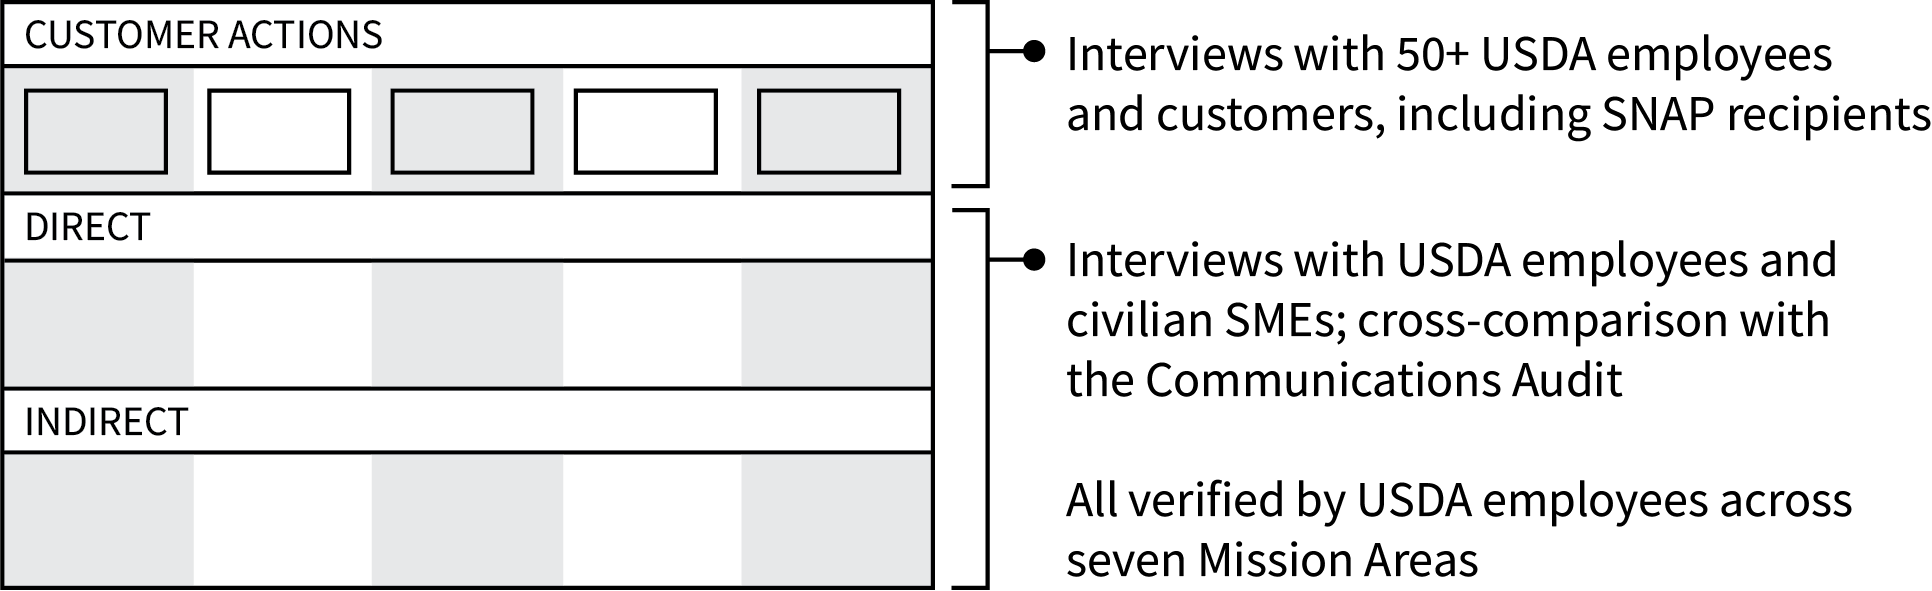
To supplement the OneUSDA Ecosystem map, we created a more traditional service blueprint, showing viewers how USDA affects the journey of Lydia as she tries to provide safe, healthy meals for her family. Viewers can see actions that Lydia performs as she directly interacts with USDA programs and services, as well as the indirect, behind-the-scenes activities that are fundamental to Lydia’s journey, even if she never sees or even knows that they occur.
Caption: Creating a Service Blueprint.
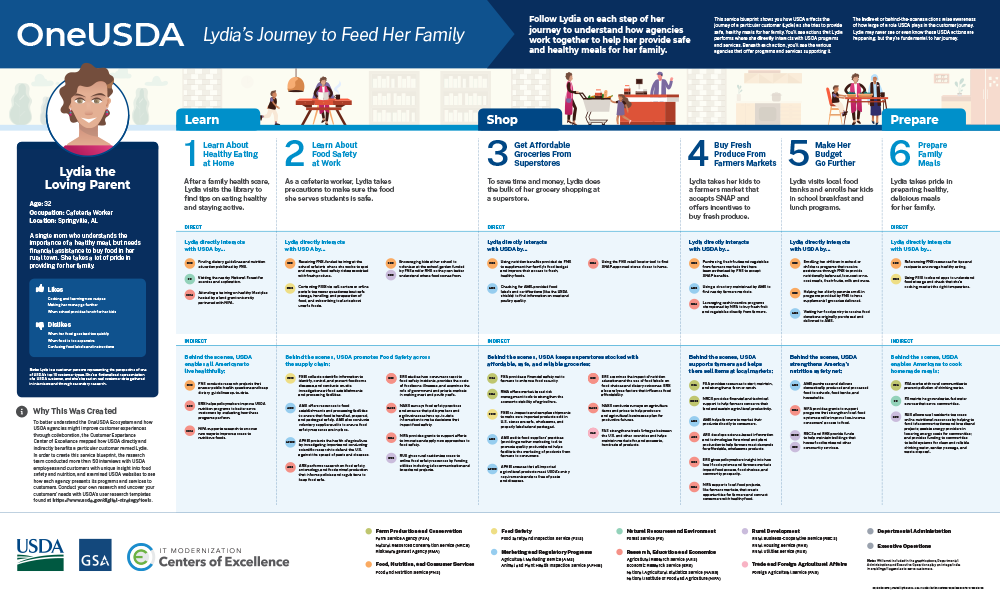
Caption: The OneUSDA Service Blueprint: Lydia’s Journey to Feed Her Family
Finally, we validated the content and visual design of both our deliverable items in 10 feedback sessions with USDA employees (including 9 whom we interviewed during the discovery phase). Ultimately, we did a total of 50 interviews (in-person and phone), and 10 feedback sessions, speaking with a total of 58 people.
Caption: We tested the Lydia Service Blueprint with USDA staff in feedback sessions.
Additional Findings: Insights and Next Steps
The team found that USDA employees are experts at their day-to-day tasks, but there is opportunity to do more to champion customer experience across the USDA. The four key insights include:
- Discovering and connecting to USDA services is a task often placed on the customer.
- Employees admit they are unaware of what other USDA agencies do, and without this institutional knowledge, they’re less able to serve their customers optimally.
- Tenure and personal connections are the primary way that employees learn about other agencies and realize opportunities for collaboration. Employees also note that it can be difficult to see beyond their immediate purview and “connect the dots” between their role, other agencyies’ roles, and the overall USDA mission.
- Finally, challenges in maintaining acollaborative culture and competing USDA employee dynamics can make work more difficult , especially when employees caution adding collaboration events to already-full workloads.
Results
Ultimately, we’ve laid a foundation for CX which USDA can build from to better understand its customers and services, and increase the overall transparency, buy-in, and employee and customer satisfaction with the agency. (And if you’re interested in mirroring this effort, check out USDA’s Digital Strategy Tools for tools and templates to guide you through the persona development and service blueprinting process.)
Return to Updates